Welcome to my blog!! I am excited to get started in the wonderful world of teaching blogs! While I still have a lot to learn, I wanted to be able to start sharing some of my ideas & resources that I use in my own classroom! 🙂
Thanks for stopping by! Enjoy!
Yesterday I did my first class graphing activity with my Kindergarten class. I was nervous to try this lesson with my kiddos, as I usually save this graphing activity for later in the school year, but I decided to give it a try!
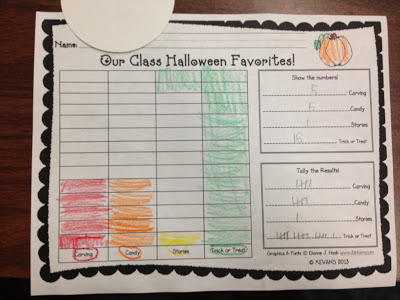
I try to do a graphing activity with my kids once a month to give my kids a chance to share their opinion about a topic and also practice their graphing and number skills!
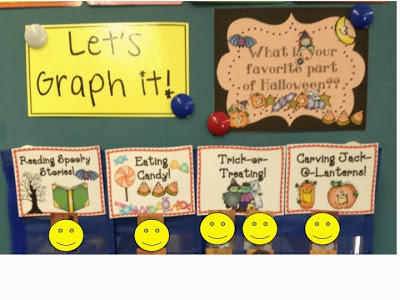
I proposed this question to my kids for our Halloween graph:
“What is your favorite part of Halloween?”
Kids were allowed to choose from the following choices:
Eating Candy, Reading Spooky Stories, Trick-or-Treating, or Carving Jack-o-lanterns. Kids voted for their favorite part of Halloween by putting their picture under the correct column on a pocket chart!


